1. INTRODUCTION
Pulse oximetry is a non-invasive method that allows to determine the percentage of oxygen saturation of hemoglobin in a patient’s blood with the help of photoelectric methods.
To perform this technique, the pulse oximeter is placed on a part of the body that is relatively translucent and has a good blood flow, for example the fingers of the hand or the foot or the earlobe. The pulse oximeter emits lights with wavelengths, red and infrared that pass sequentially from an emitter to a photodetector through the patient. The absorbance of each wavelength caused by arterial blood is measured (pulsatile component), excluding venous blood, skin, bones, muscle, fat. With these data it will be possible to calculate the oxygen saturation in blood.
physical principle
For the quantification of oximetry in blood, the engineer proposed an electric pulse oximetry circuit, which consists of a photoemitter and a photoreceptor, its operating principle consists of having the measure of reception of photons and comparing it with the photons that arrive after putting the flow of blood in the middle, this differential is known as del, and this delta refers to the amount of photons absorbed by red blood cells.
List of Equipment and Materials:
• Voltage source (Dual)
• Oscilloscope
• Connectors
• Multimeter
• BNC-Cayman
• Cayman-Cayman
• LCD (16×2)
• Arduino one
• Photodiode
• Photodetector
• 2 Infrared Diodes
• 2n2222 transistor
• 1 Resistance 470 Ω
• 1 Resistance 470 KΩ
• 7 1 KΩ resistors
• 1 10 KΩ resistors
• 2 100 KΩ resistance
• 1 Resistance of 150 KΩ
• 3 LF 353 Amplifiers
• 1 LM 358 Operational Amplifier
• The Protoboard
• Protoboard cable
• Calculation for beats per minute
2. CONTEXT
Pulse Oximeter Operation:
The device emits light with two wavelengths of 660 nm (red) and 940 nm (infrared) which are respectively characteristic of oxyhemoglobin and reduced hemoglobin. Most of the light is absorbed by the connective tissue, skin, bone and venous blood in a constant amount, producing a small increase of this absorption in the arterial blood with each beat, which means that the presence of an arterial pulse is necessary so that the device recognizes some signal. By comparing the light absorbed during the pulsatile wave with respect to basal absorption, the percentage of oxyhemoglobin is calculated. Only net absorption is measured during a pulse wave, which minimizes the influence of tissues, veins and capillaries on the result.
Image 1: representative figure of the assembly for the infrared sensor (taken from google images «pulse oximetry»)
Transimpedance Amplifiers
Photodiodes are used in a wide variety of applications to transform light into a current or voltage that can then be used in electronic circuits.
This circuit has the photodiode in «photoconductive mode» with a polarization voltage applied to the cathode. The virtual connection between the two inputs of the operational amplifier keeps the anode connected to ground, thereby applying a constant voltage of reverse bias through the photodiode. It can be considered that the photodiode is a source of current (proportional to the intensity of light), a capacitor, a high resistance and the so-called dark current, all connected in parallel. The greater the polarization voltage in the diode, the smaller the capacity of the photodiode tends to be. While this is good for speed, it is limited in practice by the ability of a photodiode to withstand high inverse voltages. The current generated by the photodiode (IPD) is amplified in the transimpedance amplifier and converted into an output voltage by the transimpedance gain resistance (also called feedback resistance or RF). Ideally all this current flows through RF (therefore, IFB = IPD), but in practice the amplifier «steals» part of this current in the form of input polarization current from the operational amplifier. This polarization current results in an error voltage at the output and limits the dynamic range. The greater the gain resistance, the greater its effect (see image 2).
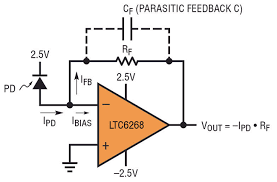
image 2: representative figure of the transimpedance amplifier assembly (taken from Google images «transimpedance circuit»)
Operational Amplifier:
An operational amplifier (op-amp), is a general purpose linear device which has signal handling capability from f = 0 Hz up to a frequency defined by the manufacturer; It also has signal limits ranging from the order of nV, to a few dozen volts. Operational amplifiers are characterized by their differential input and a very high gain, generally greater than 100dB.
The A.O is a directly coupled high gain amplifier, which is generally fed with positive and negative sources, which allows it to have excursions both above and below ground.
The ideal Operational Amplifier is characterized by:
• Input resistance, (Ren), tends to infinity.
• Output resistance, (Ro), tends to zero.
• Open loop voltage gain, (A), tends to infinity
• Bandwidth (BW) tends to infinity.
• vo = 0 when v + = v- (5)
Photodiode:
A Photodiode turns out to be a semiconductor constructed with the type of PN junction, this element is sensitive to the presence of visible and even infrared light. In short, the photodiode turns out to be a diode with sensitivity to light, being a diode it must be considered that its polarization is very important since it will be the one that makes the sensor work.
For the operation of this system to be correct, the photodiode must be polarized in an inverse manner, this will cause the circulation of a small current when the element is excited by the light.

image 3: photodium sender and receiver (taken from Google images «photodiodes»)
3. DEVELOPMENT
To calculate the beats per minute we must take into account that we must divide it between the display time we have in the oscilloscope and the number of frames between peak and peak that exists in the signal.
Fo= (60)/(200*1-3*3.5)
Fo=85ppm
Low pass filter first order (Fc = 3Hz)
The values of capacitor C are selected:
C=100nF
By means of Ecuation, the value of R3 and R4 for the low pass filter is obtained:
R3=R4=1/(2Π*3Hz*100nF)=530,51KΩ
circuit diagram
(see image 4)
Arduino Code
#include<LiquidCrystal.h>
// Incluye la librería para el LCD
LiquidCrystal lcd(12, 11, 5, 4, 3, 2);
// Define los pines de Arduino que se van a usar con el LCD
int sensorPin = A0;
// select the input pin for the potentiometer
float digital=0.00;
float digital1=0.00;
int ppm=0;
int Tprom = 0;
int timer=0;
float V1,V2,V3=0;
float sensorValue = 0;
int posicion=0;
float dataP1, dataP2 , prom ;
float Ratio=0;
void setup() {
Serial.begin(9600);
// declare the ledPin as an OUTPUT:
lcd.begin (16, 2);
lcd.setCursor(0,0);
// Escribir en primera línea
lcd.print(» ppm «);
Serial.println(«ppm»);
}
void loop() {
sensorValue = analogRead(sensorPin);
digital=((sensorValue*5.0)/1023.0);
Serial.println(digital);
V1=V2;
V2=V3;
V3=digital;
if(V2>V1 && V2 > V3){
ppm=ppm+1;
}
if(timer == 50 ){
ppm=(ppm*12);
Tprom=((Tprom+ppm)/2);
lcd.setCursor(0,1);
lcd.print(Tprom);
lcd.print(» «);
Serial.println(«ppm»);
Serial.println(Tprom);
timer=0;
ppm=0;
}
//Serial.println(timer);
timer=timer+1;
delay(100);
}
Limitations
Pulsioximetry only measures oxygenation, not ventilation, and does not replace gasometry performed by a laboratory, because it does not give indications about base deficit, carbon dioxide levels, blood pH or HCO3 bicarbonate concentration. Yes, it does arterial blood gases. Oxygen metabolism can be measured by determining CO2 in expired air (Capnography). [1] [2] [3]
4. RESULTS
see the image 5.
see the image 6.
see the image 7.
see the image 8.
see the image 9.
see the image 10.
5. GLOSARY
·Pulse oximetry
·Infrared sensor
·Transimpedance amplifiers
·Photodiodes
·Blood flow
·Beats per minute
6. ANALYSIS OF RESULTS
in the image 5 to 10, we can observate that the results in the laboratory in the image 5 at this moment it is unfortunately observed that the signal coming out of the assembly was being very affected by the noise, maybe it did not work as expected the filter that was used did not respond with enough precision with which it had been designed, only noise is observed, photo taken from the oscilloscope connected to the transimpedance assembly.
in the image 6 we can observate that the nominal value that the infrared sensor captured the blood flow, in image 7 you can also see the value, but in image 8 we saw the jump that was evidenced in the data collection with the pulse oximeter that the teacher brought to have a point of reference; in the picture 9 we observed another error which was solved, which was that it had been badly parmetrizado for the code that was used in the beginning of the tests, in the picture 10 we can see how it looked at the assembly in which the laboratory.
7. BIBLIOGRAPHY
[1]Lisa Catón V, Carpintero Escudero JM, Marco Aguiar P, Ochoa Gómez FJ. Utilidad del Pulsioximetro en un Centro de Salud. FMC 1999; 6, (8): 517- [Texto completo]
[2] Herrera Carranza M. Fisiología respiratoria. Conceptos Básicos. Iniciación a la Ventilación Mecánica. Barcelona: Edika-Med;1997.
[3] Sinex JE. Pulse oximetry: principles and limitations. Am J Emerg Med 1999 Jan; 17 (1): 59-67.[Medline]
[4] Amplificadores de Transimpedancia (2017). Los amplificadores de transimpedancia para fotodiodos de amplio rango presen- tan exigentes requisitos. Recuperado (8 de Marzo de 2018)de:“https://www.redeweb.com/ficheros/articulos/arrow.pdf “
VERY THANKS for watched this blog.
