In practice, a simulation was designed to control the supply of anesthesia to patients under normal conditions, with an error of less than 10%. For the design of the equipment with an MPX 5700 dp pressure sensor, it was previously observed to know the values.
The reading obtained from the system, the test for the Arduino board and using a programming code, the conversion required to perform the corresponding calculations was performed. An amplification of Volume and Pressure values was taken into account to ensure the appropriate mixing
2. CONTEXT
The anesthesia machines designed with circular circuit are completely different from the respirators used for ventilation in critical care areas, which are always open circuit fans. The open circuit in each breath always takes new fresh gases to ventilate the patient, and in the expiratory phase of the patient throws all the gases used outdoors. On the contrary, the circular circuit allows the anesthesiologist to take advantage of the expired gases of the patient, once the CO2 is eliminated, and to use them again to ventilate the patient again and again. This fact determines a saving of economic and environmental costs by reducing the consumption and release of anaesthetic gases. But it creates a series of potentially very dangerous complications
3. DEVELOPMENT, RESULTS AND ANALYSIS OF RESULTS
5. GLOSARY
medicinal gases states of consent analgesics oxygen
6. BIBLIOGRAPHY
Beaulieu, P., Nathan-Denizot, N., & Feiss, P. (2013). Aparatos de anestesia. EMC-Anestesia-Reanimación, 39(4), 1-27.
Enciso Nano, J. (2013, January). Anestesia en la cirugía laparoscópica abdominal. In Anales de la Facultad de Medicina(Vol. 74, No. 1, pp. 63-70). UNMSM. Facultad de Medicina.
McKelvey, D., & Hollingshead, K. W. (2003). Manual de anestesia y analgesia veterinaria. Multimedica Ed. Vet.
Gómez, J. O. (2008). Anestesia en la hipertermia maligna. Revista Española de Anestesiología y Reanimación, 55(3), 165-174.
Méndez-Beltrán, M. (2012). Ventilación mecánica en anestesia. Revista Mexicana de Anestesiología, 35(S1), 202-203.
In the present practice, it will be possible to assess the way the land is detected in the electrical networks of the establishments, the quality of the land and the importance of the land in these networks
2. CONTEXT
it is important to show the existence of land in the electrical networks of the establishments, pes this allows that the voltage that each equipment receives is the ideal one to give excellent respues of work, also that there are optimal characteristics to connect to the regulated or unregulated source of each equipment
3. DEVELOPMENT
*previous consultation
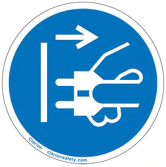
What kind of aid do you have to provide in an electrical shock case? If the victim has come into contact with a driver or piece under stress, it should be separated from the contact as a first step before trying to apply first aid. To this end:
a) The power shall be cut by turning on the switch, circuit breaker, electric cue, etc. It must not be forgotten that an electrified person who is in an elevated position is at risk of falling to the ground at the time the current is cut, put elements to cushion the fall. [1]
b) If it proves impossible to cut the current or it takes too long, because the switch is far away, try to disengage the electrified person by any non conductive element (board, ribbon, rope, wooden chair, leather belt, dry stick or branch, etc.) with which, at a distance, to prey on the cable or on the injured, or to grab the clothes being the rescuer well isolated. [1] after the person has separated from the electrical elements, first aid should be reviewed and provided, however it should be taken to the nearest health care provider unit. [2]
2. There are four main types of electrical injuries:
Flash: caused by an arc flash, are typically associated with superficial burns, as no electrical current travels past the skin.
Flame: Flame injuries occur when an arc flash ignites an individual’s clothing, and electrical current may or may not pass the skin in these cases.
Lightning: involving extremely short but very high voltage electrical energy, are associated with an electrical current flowing through the individual’s entire body.
True electrical injuries: True electrical injuries involve an individual becoming part of an electrical circuit. In these cases, an entrance and exit site is usually found.[3]
*Questionnaire
The most important risk factor according to Retie 90. It is what its frequency is that it happens varies sometimes to the MES and can carry consequences such as one or several deaths, serious damage to infrastructure, irreparable pollution.
Electrical
safety symbols are safety symbols to warn people that serious injuries can
occur from burn, electric shocks, and hazards.
These tragedies can be prevented injuries. Electrical safety signs and
electrical safety symbols are imperative in warning people that electrical
hazards are probable while working and also remind them to take the necessary
steps to stay safe.
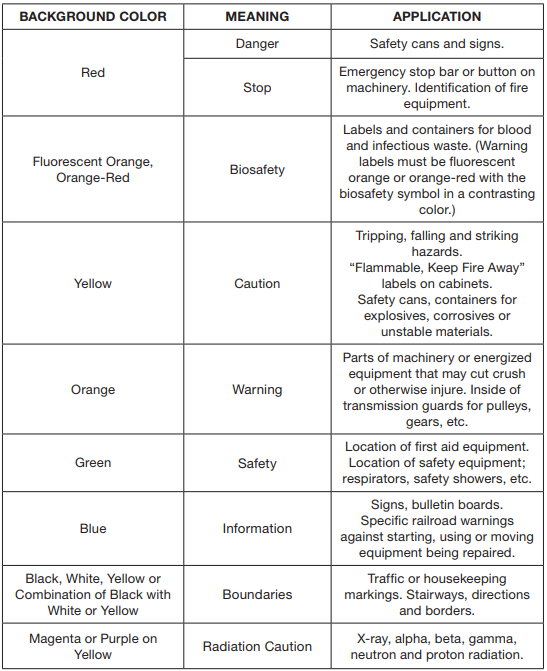
The
colors are:
[4]
The symbols are:
The common symbol
for electricity is:
*by copyright policies, the images shown below, the page is shown and not only the Symbol!!!!!
Is a
lightning bolt.
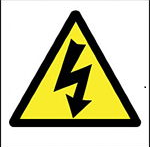
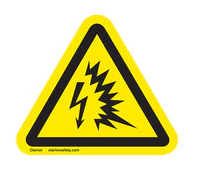
Voltage
or Shock Hazard Symbol:This symbol can be identified by using a bolt or a
bolt through a hand.
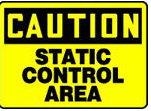
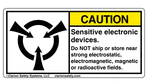
Static Hazards: If you see a
lightning bolt on the bottom of a shoe, there is a danger of an explosion
occurring from static electricity.
Buried Cable Symbol: A bolt with an arrow pointed downward is used to
identify buried cable signs.
Danger/Safety (Universal): A triangle with an enclosed exclamation point is the
universal symbol for danger and sometimes safety as well.
Restricted Areas: Prohibition signs
are used in areas to prevent people from walking into a danger zone.
Electrical Devices: Appliances, switches, wire boxes and other electrical
devices are often marked with an electrical safety sign.
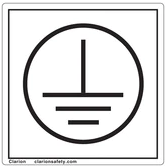
Protective Earth Ground Label: Clarion Safety Systems brings you high quality protective earth ground
safety labels.
Arc Flash Label: Clarion Safety Systems
brings you high quality arc flash safety labelsClarion Safety Systems brings
you high quality arc flash safety labels.
The most important risk factor according to Retie 90. It is what its frequency is that it happens varies sometimes to the MES and can carry consequences such as one or several deaths, serious damage to infrastructure, irreparable pollution.
4. RESULTS
fase
neutro
grownd
orange
118.7
118.7
1.3
white
119.5
119.5
0.5
5. GLOSARY
Electricity: A form of energy that produces luminous, mechanical, calorific, chemical, etc., effects due to the separation or movement of the electrons that form the atoms.
Earth: ground is a driver with a protective function, the aim is to lead possible on shore stresses.
Live wire: is an active conductor that carries the electrical current normally from the grid to a plug or switch in our home or office.
Neutral: neutral Its function is to create an imbalance, a potential difference that allows the existence of electric current by the Phase conductor.
Safety: One definition within the security sciences is «interdisciplinary science that is responsible for assessing, studying and managing the risks faced by an individual, good or environment».
6. ANALYSIS OF RESULTS
In practice it was carried out, and it reached a compression of great importance in the field of electronics and electricity, since it was treated the utility of the grownd in the electrical networks, besides protecting the equipment, serves to ensure the voltage seen by the neutral and the phase, as well as the grownd, the gownd has a voltage arround to 1,5V, in this way it can be known when an electrical network possesses a real land or a phytic land, in our country we see a lot of the fictitious earth, this lowers infrastructure costs and in many households not to say that all, bridge the neutral to the grownd, but this brings with it a big problem, at the time of an overcharging does not have a place to go the current and cause the damage of the equipment connected to this network, For this each establishment that manages electrical network must guarantee its system of protection to electrical network, and with I follow the design of a land that isosle the charges.
On the basis of the above explanation, it is noted that the classroom where the practice was performed does not have its land insulation system, since the voltage valves measured in the grownd were 0,8V, and 1,3V which means no real land is presented, for the,which gives us the answer «why the circuits in the 506 classroom do not have an optimal performance.
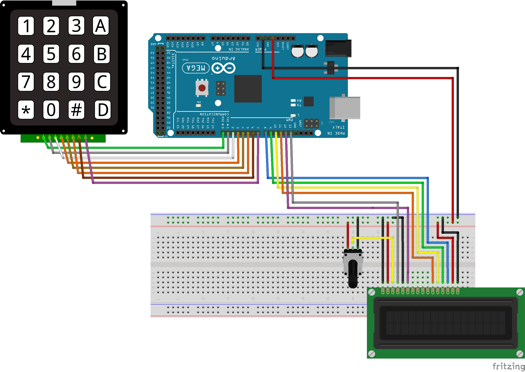
This test assesses your ability to hear sounds. The sounds vary according to the volume or force (intensity) and the speed of vibration of the sound waves (tone). Hearing occurs when the sound waves stimulate the nerves of the inner ear. The sound then travels along the nerve pathways to the brain.Audiometry provides a more accurate measurement of hearing. For this test, hearing aids that are connected to the audiometer are used. Pure tones of controlled intensity are generally transmitted to one ear at a time. It is requested to raise your hand, press a button or indicate otherwise when you hear a sound.List of Equipment and Materials:• Voltage source (Dual)• Oscilloscope• Connectors•Multimeter• LCD (16×2)• Arduino one• 1 Mega potentiometer• 50 KΩ potentiometer• Dip switch with 4 positions• 8-position dip switch• 1 Resistance 470 KΩ• 7 1 KΩ resistors• 1 10 KΩ resistors• 2 100 KΩ resistance• 1 Resistance of 150 KΩ• 1 LM 358 Operational Amplifier• The Protoboard• Protoboard cable2.
CONTEXT
The sound waves can travel to the inner ear through the external auditory canal, the eardrum and the bones of the middle ear (air conduction). They can also pass through the bones that are around and behind the ear (bone conduction). The INTENSITY of sound is measured in decibels (dB):A whisper is approximately 20 dB.The loud music (some concerts) is around 80 to 120 dB.The engine of a jet is roughly 140 to 180 dB. Sounds with more than 85 dB can cause hearing loss after a few hours. Stronger sounds can cause immediate pain and loss of hearing can occur in a very short time. The TONE of sound is measured in cycles per second (cps) or Hertz:The bass tones of a bass fluctuate between 50 to 60 Hz.The highest elevation treble tones are approximately 10,000 Hz or more. The normal range of hearing of humans is approximately 20 to 20,000 Hz. Some animals can hear up to 50,000 Hz. Human language is generally between 500 and 3,000 Hz. [1]General Objective: Design an audiometer that produces pure tones of several specific frequencies that can be heard through headphones and allow them to be visualized in LCD (16×2) with the help of the arduino to determine the auditory response of a patient.
List of Equipment and Materials: • Voltage source (Dual) • Oscilloscope • Connectors • Multimeter • LCD (16×2) • Arduino one • 1 Mega potentiometer • 50 KΩ potentiometer • Dip switch with 4 positions • 8-position dip switch • 1 Resistance 470 KΩ • 7 1 KΩ resistors • 1 10 KΩ resistors • 2 100 KΩ resistance • 1 Resistance of 150 KΩ • 1 LM 358 Operational Amplifier • The Protoboard • Protoboard cableAudiometry
It is a test to assess the auditory capacity through the stimulation of the auditory system by means of the use of pure sounds of different tones at the same intensity or of the same tone at different intensities generated by an electronic instrument designed for this purpose. It is used in the population occupationally exposed to noise, as a tool for the early detection of cases of hearing damage, ideally when they are still asymptomatic, as well as to evaluate the effectiveness of the management carried out in the Epidemiological Surveillance Systems or Programs to control this factor. risk in work environments.Recommendations for the realization of audiometry:• The worker must have an auditory rest of 8 hours before performing the audiometry.• The audiometry will not be performed if at the time of the examination the patient presents infectious processes such as pharyngitis, sinusitis, bronchitis, otitis, etc.• The patient should not have auditory rest for the previous 8 hours (no exposure to work noise, no hearing with headphones) [2]
figure 1. test audiometryTypes of audiometryThe audiometry is carried out evaluating the “airway” and “the bone pathway”:• The airway: assesses the ability to detect sounds presented / transmitted through the air, specifically through headphones.• Bone pathway: assesses the ability to detect sounds transmitted through the bones of the head. In this case a vibrator is used that is placed behind the ear.Operational Amplifier:An operational amplifier (op-amp), is a general purpose linear device which has signal handling capability from f = 0 Hz up to a frequency defined by the manufacturer; It also has signal limits ranging from the order of nV, to a few dozen volts. Operational amplifiers are characterized by their differential input and a very high gain, generally greater than 100dB.The A.O is a directly coupled high gain amplifier, which is generally fed with positive and negative sources, which allows it to have excursions both above and below ground.The ideal Operational Amplifier is characterized by: • Input resistance, (Ren), tends to infinity. • Output resistance, (Ro), tends to zero. • Open loop voltage gain, (A), tends to infinity • Bandwidth (BW) tends to infinity. • vo = 0 when v + = v- [3]
XR2206:XR2206 is an integrated circuit designed by Exar Corporation, which can be used as a generator of signals of sine waves, squares, pulses, triangular and sawtooth, the frequency and wave amplitude can be varied if the voltage is controlled. It can also be used as a voltage to frequency converter, making it suitable for use as a radio frequency transmitter, either FM or AM.3.
DEVELOPMENT
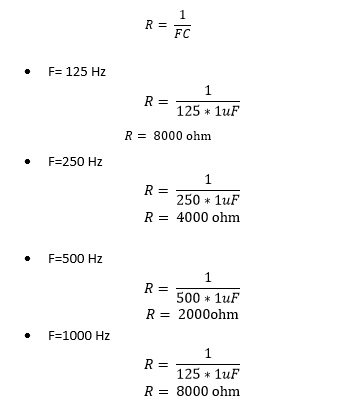
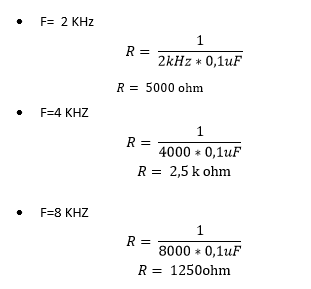
The operational characteristics of the XR2206 and the values of the components used are the following: • Supply voltage between 10 and 26V. • Power supply between 12 and 17 mA. • Operating frequencies between 0.1 Hz and 1 Mhz. • Temperature stability from 10 to 50 ppm / oC. • Stability in io amplitude, 5 dB: from 0.5Hz to 1MHz. • Amplifier output impedance: 6,000. • Linearity of the triangular serial: better than 1%. • Distortion of sinusoidal signals: less than 0.4%. • Maximum amplitude of the triangular signals: 3V. • Maximum amplitude of the sinusoidal signals: 0.8V. • Recommended value of the distortion setting: 470 Ω. • C value: between 1 nF and 100 μF. • Command levels of the FSK input: 0.8 to 2.4V. • Input impedance AM: 50 to 100 K. [4]
figure 2
image 3 calculation of the resistors image 4 calculations of the frecuency image 4 calculations of the decibeles
COUPLE
It has also been necessary to perform a coupling of the hearing aids with respect to the circuits since for some frequencies in the square signal to be more specific, the audio signal is not perceptible.
For the calculation of the beats per minute we must take into account that we must divide it between the display time that we have in the oscilloscope and the number of frames between peak and peak that exists in the signal
5. ANALISYS OF THE RESULTS
For the design of the Audiometer there were different stages. The first stage in the class session was the design of the audiometer as such and understanding the whole theoretical part of the frequency and decibel handling in the patient, the second stage was the assembly of the audiometer without visualization with In order to be able to listen to the hate, either simultaneously or interspersed with the frequency in the third stage, the part of the arduino code was added with the visualization on the LCD with the main objective of observing frequencies and decibels (db) based on the arduino code, but for this code there were too many drawbacks since the frequencies were sometimes not shown properly on the lcd and in the same way it happened with the part of the db, what was done as the next and last stage was analyze the code carefully and try new variables so that the visualization was appropriate and made sense.
Finally, a positive result was obtained when observing different sound frequencies and decibels in the patient, since the code used in the Arduino was the expected one since the visualization was given correctly in the LCD without any anomaly; observing additionally on the screen.Where the hearing ability of the human being can degenerate due to the different sound variations that occur in the middle. In addition, the human being has the ability to hear sounds with frequencies from 20 to 20,000 Hz.6.
BIBLIOGRAFY
[1]Medlineplus (2017).Audiometría. Recuperado (10 de mayo de 2018) en “https://medlineplus.gov/spanish/ency/article/003341.htm” [2]Audiología (2017).Audiología Blog . Recuperado (10 de mayo de 2018) en “https://audiologiablog.wordpress.com/tipos-de-perdida-auditiva/” [3] ¿Qué es un amplificador operacional (2013)? Amplificador. .Recuperado (8 de Marzo de 2018)de:“http://www.pablin.com.ar/electron/cursos/introao1/quees.html[4] XR-2206 (2017).Control de frecuencia . Recuperado (10 de Mayo de 2018)de:“ http://www.vwlowen.co.uk/arduino/xr2206/XR2206-function-generator.htm “
The centrifugation is a mechanical method of separation of immiscible liquids, or solids and liquids by the application of a centrifugal force. This force can be very large. The separations that are carried out slowly by gravity can be accelerated to a great extent with the use of centrifugal equipment. Centrifugal or centrifugal pumps are used in different types of industries: chemical industry, petrochemical, refineries, food, pharmaceutical, textile, sugar, etc.
Spirometry is a basic test for the study of pulmonary function, and its performance is necessary for the evaluation and monitoring of respiratory diseases. Its usefulness transcends the field of pulmonology, and in recent years it is progressively being incorporated into primary care and other medical disciplines.
The spirometer is a technique for the diagnosis of respiratory diseases, because it offers a variety of data that allow a complete diagnosis. Thanks to the advancement of technology, it is easy to perform the examination, by calculating flow and volume, important variables in the spirometer technique. it is possible to determine if there is obstruction in the respiratory tract or if, on the contrary, they are in a healthy state.
List of Equipment and Materials:
Engine
arduino
arduino conector
optocuupler 4n26
protoboard
lcd
transistor 2n2222
switch
2. CONTEXTTS
During the practice a tensiometer was developed by means of a silicon pressure sensor designed for a wide range of which is the MPX5100dp, by means of the designed code the visualization of the diastolic and average systolic pressure in an LCD is allowed.
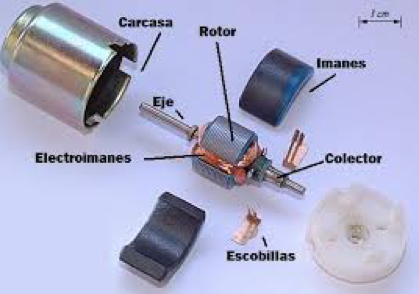
ENGINE
The DC motor (DC motor) is a machine that converts electrical energy into mechanical, causing a rotary movement. In some modifications, they exert traction on a rail. These engines are known as linear motors. A direct current machine (generator or motor) consists mainly of two parts, a stator that gives mechanical support to the device and has a hole in the center, generally cylindrical in shape. In the stator there are also poles, which can be permanent magnets or windings with copper wire on an iron core. The rotor is generally cylindrical in shape, also wound and with a core, to which the current comes through two brushes. (National Experimental University of Táchira Department of Electronic Engineering Nucleus of Electricity Curricular Unit Electrical Technology) [3]
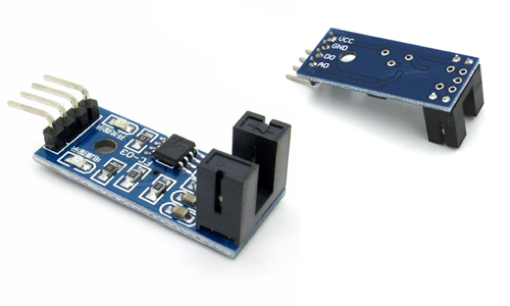
ENCODER
Encoders convert the movement into an electrical signal that can be read by some type of control device in a motion control system, such as a counter or PLC. The encoder sends a response signal that can be used to determine the position, count, speed or direction. A control device can use this information to send a command for a particular function. [1] (ENCODER PRODUCTS COMPANY).
OPTOACOPLATOR
An optocoupler, also called optoisolator or optically coupled isolator, is an emitting and receiving device that functions as a switch activated by light emitted by an LED diode that saturates an optoelectronic component, usually in the form of a phototransistor or phototriac.
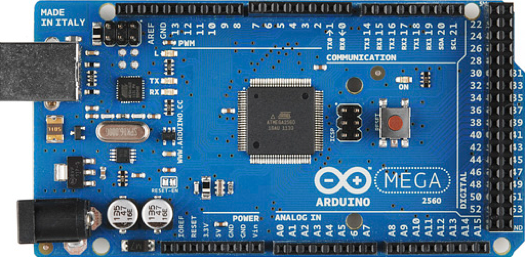
ARDUINO
Arduino is a free hardware platform, based on a board with a microcontroller and a development environment, designed to facilitate the use of electronics in multidisciplinary projects. On the other hand Arduino provides us with software consisting of a development environment (IDE) that implements the programming language of arduino and the bootloader executed on the board. The main feature of programming software and the programming language is its simplicity and ease of use. [2]
3. DEVELOPMENT
4. RESULTS
5. ANALISYS OF THE RESULTS
For the design of the centrifuge there were different stages. The first stage in the class session was the prototype of the centrifuge where the alarm system was installed to determine when the lid is lifted then the characterization of the encoder was proceeded, in order to observe the operation of the encoder with light and observing the variation of voltage in the output that in some cases was too short, the second stage was the programming of the keyboard so that when a number was entered it would print in order to show the revolutions per minute and time on the LCD.
I tested that the keyboard worked properly observing it on the LCD the time and the revolutions per minute correspondingly and taking out the respective calculation of the revolutions per minute in order to look at the speed at which the encoder rotates , in the third stage the part of the arduino code was added with the visualization in the LCD with the objective main to observe already the RPM in the LCD and the time (seconds) and the fixed dual power, but for this code there were too many inconveniences since the ranges that were managed to have a greater accuracy in the RPM was too difficult to calibrate that the code took too many values to get an accurate RPM but not exact, what was done as the next and last stage was to analyze the code carefully and place certain conditions so that it would not take so many values at a certain time and so with the help of the clamp an accuracy like that achieved by observing an adequate RPM value.
Finally, a positive result was obtained when observing the RPM per minute in the structure, since the code used in the Arduino was the expected one since the visualization was given correctly in the LCD without any anomaly; observing additionally on the screen both the time and the revolutions per minute according to the values chosed
[3]Universidad Nacional Experimental del Táchira Departamento de Ingeniería Electrónica Núcleo de Electricidad Unidad Curricular Tecnología Eléctrica. (s.f.). Conceptos Básicos de Máquinas de corriente continua. págs. file:///C:/Users/olgabeatriz/Downloads/MotoresDC-conceptosbasicos-MAPC.pdf.
In practice, a device was designed that allows the measurement of a patient’s blood pressure under normal conditions, with an error of less than 10%. For the design of the equipment with an MPX 5700 Dp pressure sensor, it was previously observed to know the corresponding voltage values of each pressure, making use of a system consisting of a bracelet, a manometer and an insufflation pump.
The obtained reading of the system, the test for the Arduino board and by means of a programming code, the conversion required to perform the calculations corresponding to the systolic, diastolic and media evaluated was performed. An amplification of the voltage values obtained from the pressure sensor for an adequate analog reading was taken into account. Subsequently, all data was displayed on the screen.
One of the first elements to measure blood pressure arose in 1816 after the invention of the stethoscope by the French physician Rene Laennec. In 1828 Jean Marie Poiseuille exhibited in his doctoral work, the first apparatus composed of mercury to measure blood pressure and Karl von Vierordt in 1854 designed the first device that allows to measure blood pressure in a non-invasive way.
In 1896, the Italian doctor Scipione Riva-Rocci created the cuff-mounted blood pressure cuff, based on research carried out in the 19th century. In 1905 Nikolai Korotkoff implemented the stethoscope on the brachial artery to perceive the most precise noises.
From 1950 the tensiometer has become an important device for medical diagnosis.
It is a medical instrument used for the indirect measurement of blood pressure, which usually provides it in physical pressure units, usually in millimeters of mercury.
It consists of an inflatable cuff system, plus a manometer (pressure gauge) and a stethoscope to clearly hear the range of KorotKoff sounds (systolic and diastolic).
Blood pressure represents the pressure exerted by the blood against the wall of the arteries. It depends on the following factors:
Systolic debit (volume of ejection of the left ventricle)
Disability of the aorta and the great arteries.
Peripheral vascular resistance, especially at the arteriolar level, which is controlled by the autonomic nervous system.
Volemia (volume of blood within the arterial system)
Image 1. Tensiometer on the arm
Systolic pressure (using the auscultatory method)
The cuff is insufflated again, but this time the capsule of the stethoscope is placed in the fold of the forearm, over the place where the brachial pulse is palpated. The cuff is inflated to a little above the systolic pressure obtained by the palpation method and then slowly deflated. The pressure in which you start is to hear a noise related to the heart beats corresponds to the systolic pressure obtained by the auscultatory method. Both the record obtained by the palpation method and the auscultatory should be similar. If this is not the case, the highest value is recorded as systolic pressure.
Diastolic pressure
After identifying the auscultatory systolic pressure, the cuff continues to deflate until the noises disappear. This moment corresponds to the diastolic pressure. Sometimes, the noises are attenuated first and then disappear. In general, the diastolic pressure is considered as the moment in which the noises disappear. If it happens that the noises are attenuated, but never stop listening, even with the cuff deflated, the diastolic pressure corresponds to the moment when the noises were attenuated. Sometimes both moments are recorded: when the noises are attenuated and when they disappear.
Normal values of blood pressure
Systolic pressure: between 100 and 140 mm Hg (ideally, it should have a systolic pressure that does not exceed 120 mm Hg, or, at most, 130 mm Hg). Diastolic pressure: between 60 and 90 mm Hg (ideally, you should have a diastolic pressure below 90 mm Hg).
A patient is considered to be starting to be hypertensive when his or her registration is equal to or greater than 140/90 mm Hg. Some people, especially young women, have pressures that are usually low (100/60 mm Hg or even less). In other situations, low blood pressure is a manifestation of shock or circulatory collapse, but in these cases, there are signs of poor tissue perfusion (compromise of conscience, cold extremities, poor diuresis).
When there is an accentuated arrhythmia, as in atrial fibrillation, the determination of blood pressure is a little more difficult. In these cases, it is advisable to deflate the cuff slowly and, if necessary, repeat the measurement to see how consistent the values obtained are. In atrial fibrillation, automatic digital manometers can register erroneous values.
3. DEVELOPMENT
DIFFERENTIAL PRESSURE SENSOR MPX5700
Figure 2. Pin connection specifications of the MPX5700 Dp sensor
Pressure Range
0KPa – 700Kpa
Voltage
min. 4.75v máx. 5.25 v
Current
10mAdC
temperature
-40 a 125°C
Sensitivity
6.4 mV/KPa
resopond time
1.0 ms
Table 1. MPX5700 sensor technical specifications
CARACTERIZACIÓN
Pressure (mmHg)
Voltage (v)
Pressure (mmHg)
Voltage (v)
190
3,17
90
2,56
180
3,11
80
2,49
170
3,04
70
2,42
160
2,97
60
2,34
150
2,9
50
2,29
140
2,84
40
2,21
130
2,76
30
2,15
120
2,7
20
2,07
110
2,63
10
2,02
100
3,17
0
1,92
Table 2. Voltage values obtained with the multimeter for the MPX 5700 Dp Sensor
Graph 1. Characterization of the MPX5700 sensor with multimeter
Using the multimeter, the characteristic voltage measurement of the MPX5700 sensor was made with respect to the pressure variation of the system as shown in table 2. For this purpose, a non-inverting gain amplifier 10 was designed to obtain more voltage values. elevated. The objective of the measurement was to obtain the equation of the line to be implemented in the programming code.
Pressure (mmHg)
Voltage (v)
Pressure (mmHg)
Voltage (v)
190
820
90
630
180
800
80
615
170
780
70
592
160
763
60
573
150
744
50
554
140
727
40
531
130
700
30
511
120
686
20
490
110
661
10
469
100
645
0
457
Table 3. Voltage values obtained by the Arduino board for the MPX 5700 Dp Sensor
Table 3 shows the voltage values obtained directly from the analog reading presented by the Arduino board, based on the pressure variation. This procedure was carried out in order to obtain a more precise equation of the line.
image 3. characteritization of MPX5700
Patient 1. Rincon Oscar
PS
124 mmHg
PD
84 mmHg
Patient 2. Garzon Jaime
PS
119 mmHg
PD
82 mmHg
Table 4. Theoretical values of systolic and diastolic pressure
for (int i=0; i<50; i++)
{
sensor=analogRead(A0); //lee lo del sensor
sensora=(sensor*5)/1023; //convierte digital
sensorb=(sensora/0.006);
sensoru=sensorb -0,2459; //pasa a unidades presion
sensorc[i]=sensoru;//guarda en el vector
In the practice of tensiometer was made, making use of the differential pressure sensor MPX5700DP, to be able to check blood pressure in a patient under normal conditions. Initially the sensor was characterized, to know the voltage values for each pressure generated from the tensiometer. These voltage values were maintained in the order of the mv, for this reason a non-inverting gain amplifier 10 was implemented to be read by the arduino board. This characterization was carried out in two ways; the first was with the measurement of voltages by means of the multimeter and the second was done by measuring the values directly from the arduino under an analogous reading.
Once the characterization of the sensor was obtained, we proceeded to plot the slope in Excel, to take the equation and use it in the programming code, to know the pressure values. The system had to record the systolic and diastolic pressures of the evaluated patient, by means of the voltage variation and by means of the theoretical equations, the pulse pressure and average could be calculated, but if the Bpm could be implemented, it can be evidenced in the video .
In the programming code, conditionals were used for each characteristic voltage range of each pressure, which were implemented in the theoretical formulas and later visualized on the screen. Finally, to verify the error percentage of the experimental values, a comparison was made with the (theoretical) values obtained from the commercial tensiometer and a stethoscope, it was evidenced a very close approximation to the measurement made by the teacher who evaluated the procedure.
Robert, L Boylestad and Louis Nashelsky, Electronica: Teoria de Circuitos y Dispositivos Electronicos, Desima ed., Castillo, Ed. Mexico: Pearson, 2009.
D. Schneider, “Ride by wire,” Proc. IEEEvol.pp. 22-23, May 2013.
Pulse oximetry is a non-invasive method that allows to determine the percentage of oxygen saturation of hemoglobin in a patient’s blood with the help of photoelectric methods.
To perform this technique, the pulse oximeter is placed on a part of the body that is relatively translucent and has a good blood flow, for example the fingers of the hand or the foot or the earlobe. The pulse oximeter emits lights with wavelengths, red and infrared that pass sequentially from an emitter to a photodetector through the patient. The absorbance of each wavelength caused by arterial blood is measured (pulsatile component), excluding venous blood, skin, bones, muscle, fat. With these data it will be possible to calculate the oxygen saturation in blood.
physical principle
For the quantification of oximetry in blood, the engineer proposed an electric pulse oximetry circuit, which consists of a photoemitter and a photoreceptor, its operating principle consists of having the measure of reception of photons and comparing it with the photons that arrive after putting the flow of blood in the middle, this differential is known as del, and this delta refers to the amount of photons absorbed by red blood cells.
List of Equipment and Materials:
• Voltage source (Dual)
• Oscilloscope
• Connectors
• Multimeter
• BNC-Cayman
• Cayman-Cayman
• LCD (16×2)
• Arduino one
• Photodiode
• Photodetector
• 2 Infrared Diodes
• 2n2222 transistor
• 1 Resistance 470 Ω
• 1 Resistance 470 KΩ
• 7 1 KΩ resistors
• 1 10 KΩ resistors
• 2 100 KΩ resistance
• 1 Resistance of 150 KΩ
• 3 LF 353 Amplifiers
• 1 LM 358 Operational Amplifier
• The Protoboard
• Protoboard cable
• Calculation for beats per minute
2. CONTEXT
Pulse Oximeter Operation: The device emits light with two wavelengths of 660 nm (red) and 940 nm (infrared) which are respectively characteristic of oxyhemoglobin and reduced hemoglobin. Most of the light is absorbed by the connective tissue, skin, bone and venous blood in a constant amount, producing a small increase of this absorption in the arterial blood with each beat, which means that the presence of an arterial pulse is necessary so that the device recognizes some signal. By comparing the light absorbed during the pulsatile wave with respect to basal absorption, the percentage of oxyhemoglobin is calculated. Only net absorption is measured during a pulse wave, which minimizes the influence of tissues, veins and capillaries on the result.
Image 1: representative figure of the assembly for the infrared sensor (taken from google images «pulse oximetry»)
Transimpedance Amplifiers
Photodiodes are used in a wide variety of applications to transform light into a current or voltage that can then be used in electronic circuits.
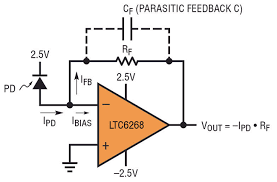
This circuit has the photodiode in «photoconductive mode» with a polarization voltage applied to the cathode. The virtual connection between the two inputs of the operational amplifier keeps the anode connected to ground, thereby applying a constant voltage of reverse bias through the photodiode. It can be considered that the photodiode is a source of current (proportional to the intensity of light), a capacitor, a high resistance and the so-called dark current, all connected in parallel. The greater the polarization voltage in the diode, the smaller the capacity of the photodiode tends to be. While this is good for speed, it is limited in practice by the ability of a photodiode to withstand high inverse voltages. The current generated by the photodiode (IPD) is amplified in the transimpedance amplifier and converted into an output voltage by the transimpedance gain resistance (also called feedback resistance or RF). Ideally all this current flows through RF (therefore, IFB = IPD), but in practice the amplifier «steals» part of this current in the form of input polarization current from the operational amplifier. This polarization current results in an error voltage at the output and limits the dynamic range. The greater the gain resistance, the greater its effect (see image 2).
image 2: representative figure of the transimpedance amplifier assembly (taken from Google images «transimpedance circuit»)
Operational Amplifier:
An operational amplifier (op-amp), is a general purpose linear device which has signal handling capability from f = 0 Hz up to a frequency defined by the manufacturer; It also has signal limits ranging from the order of nV, to a few dozen volts. Operational amplifiers are characterized by their differential input and a very high gain, generally greater than 100dB.
The A.O is a directly coupled high gain amplifier, which is generally fed with positive and negative sources, which allows it to have excursions both above and below ground.
The ideal Operational Amplifier is characterized by:
• Input resistance, (Ren), tends to infinity.
• Output resistance, (Ro), tends to zero.
• Open loop voltage gain, (A), tends to infinity
• Bandwidth (BW) tends to infinity.
• vo = 0 when v + = v- (5)
Photodiode: A Photodiode turns out to be a semiconductor constructed with the type of PN junction, this element is sensitive to the presence of visible and even infrared light. In short, the photodiode turns out to be a diode with sensitivity to light, being a diode it must be considered that its polarization is very important since it will be the one that makes the sensor work. For the operation of this system to be correct, the photodiode must be polarized in an inverse manner, this will cause the circulation of a small current when the element is excited by the light.
image 3: photodium sender and receiver (taken from Google images «photodiodes»)
3. DEVELOPMENT
To calculate the beats per minute we must take into account that we must divide it between the display time we have in the oscilloscope and the number of frames between peak and peak that exists in the signal.
Fo= (60)/(200*1-3*3.5)
Fo=85ppm
Low pass filter first order (Fc = 3Hz)
The values of capacitor C are selected:
C=100nF
By means of Ecuation, the value of R3 and R4 for the low pass filter is obtained:
R3=R4=1/(2Π*3Hz*100nF)=530,51KΩ
circuit diagram
(see image 4)
Arduino Code
#include<LiquidCrystal.h>
// Incluye la librería para el LCD
LiquidCrystal lcd(12, 11, 5, 4, 3, 2);
// Define los pines de Arduino que se van a usar con el LCD
int sensorPin = A0;
// select the input pin for the potentiometer
float digital=0.00;
float digital1=0.00;
int ppm=0;
int Tprom = 0;
int timer=0;
float V1,V2,V3=0;
float sensorValue = 0;
int posicion=0;
float dataP1, dataP2 , prom ;
float Ratio=0;
void setup() {
Serial.begin(9600);
// declare the ledPin as an OUTPUT:
lcd.begin (16, 2);
lcd.setCursor(0,0);
// Escribir en primera línea
lcd.print(» ppm «);
Serial.println(«ppm»);
}
Limitations
Pulsioximetry only measures oxygenation, not ventilation, and does not replace gasometry performed by a laboratory, because it does not give indications about base deficit, carbon dioxide levels, blood pH or HCO3 bicarbonate concentration. Yes, it does arterial blood gases. Oxygen metabolism can be measured by determining CO2 in expired air (Capnography). [1] [2] [3]
4. RESULTS
see the image 5.
see the image 6.
see the image 7.
see the image 8.
see the image 9.
see the image 10.
in the image 5 to 10, we can observate that the results in the laboratory in the image 5 at this moment it is unfortunately observed that the signal coming out of the assembly was being very affected by the noise, maybe it did not work as expected the filter that was used did not respond with enough precision with which it had been designed, only noise is observed, photo taken from the oscilloscope connected to the transimpedance assembly.
in the image 6 we can observate that the nominal value that the infrared sensor captured the blood flow, in image 7 you can also see the value, but in image 8 we saw the jump that was evidenced in the data collection with the pulse oximeter that the teacher brought to have a point of reference; in the picture 9 we observed another error which was solved, which was that it had been badly parmetrizado for the code that was used in the beginning of the tests, in the picture 10 we can see how it looked at the assembly in which the laboratory.
7. BIBLIOGRAPHY
[1]Lisa Catón V, Carpintero Escudero JM, Marco Aguiar P, Ochoa Gómez FJ. Utilidad del Pulsioximetro en un Centro de Salud. FMC 1999; 6, (8): 517- [Texto completo]
[2] Herrera Carranza M. Fisiología respiratoria. Conceptos Básicos. Iniciación a la Ventilación Mecánica. Barcelona: Edika-Med;1997.
[3] Sinex JE. Pulse oximetry: principles and limitations. Am J Emerg Med 1999 Jan; 17 (1): 59-67.[Medline]
[4] Amplificadores de Transimpedancia (2017). Los amplificadores de transimpedancia para fotodiodos de amplio rango presen- tan exigentes requisitos. Recuperado (8 de Marzo de 2018)de:“https://www.redeweb.com/ficheros/articulos/arrow.pdf “
The electrocardiograph is a device that can capture and expand the electrical activity of the heart. It is a graphic representation of the electrical impulses of the heart and allows to measure and record the P, Q, R, S, and T wave characteristics, which vary between patients and can give the patient’s state of health. Interferences or noise on the signal register are unavoidable and are due to many causes, which can sometimes be controllable, but in others, it is therefore important to generate a system that allows the greatest cleanliness and clarity in the registry of the electrical activity. The amplitudes of the ECG depend on the connection sites of the electrodes, the size and the physical condition of the patient.
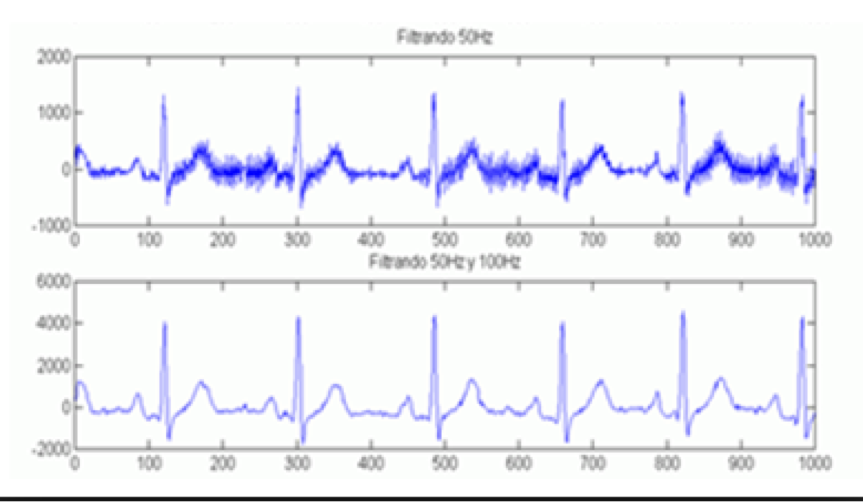
The filters are of great importance, because they are used frequently in electronic systems, the band-pass filters are those that allow the passage of frequency components contained in a certain frequency range, understood between A higher and lower frequency of cut but the Notch. or removes band filters, is the one that hinders the passage of frequency components
2. CONTEXT
List of Equipment and Materials: • Voltage source (Dual) • Oscilloscope • Signal generator • Connectors • Multimeter • BNC-Cayman • 100 nf capacitor • 10 nf capacitor • 4 15 KΩ resistors • Lf 353 Operational Amplifier • The Protoboard • Protoboard cable • 4 Trimers • 2 Capacitors 10 pcs • 6 Potentiometers of 10 KΩ and 100KΩ • 2 Capacitor 4.7uf • Resistance of 270 Ω • Resistance of 330 Ω • Resistance of 1K Ω • 10 KΩ resistance • 100 KΩ resistance • 4n25 optocoupler
Band Pass Filter: The band pass filter fulfills the function of letting certain frequencies located within a certain bandwidth pass, and attenuates those that are outside this bandwidth. It is the lower cutoff frequency (f1) and the upper cutoff frequency (f2) that determine, from their position, which will be the frequencies lower than f1 and higher than f2 to be attenuated. A bandpass filter has three parameters: frequency f0, gain and Q factor related to the width of the band.[1]
Notch filter: It is characterized by rejecting a certain frequency that is interfering with a circuit, in our case the frequency of 60Hz that is generated by the power line. The circuit is exposed to environmental noise that comes from fluorescent lamps and other devices that emit noise through 60 Hz waves. The NOTCH filter will be responsible for exclusively rejecting the 60 Hz noise to deliver a completely pure signal to the output. of distortions. [3]
3. DEVELOPMENT
image 2. calculations capacitos, resistors and band pass filter.image 3. calculations capacitos, resistors and low pass filter.
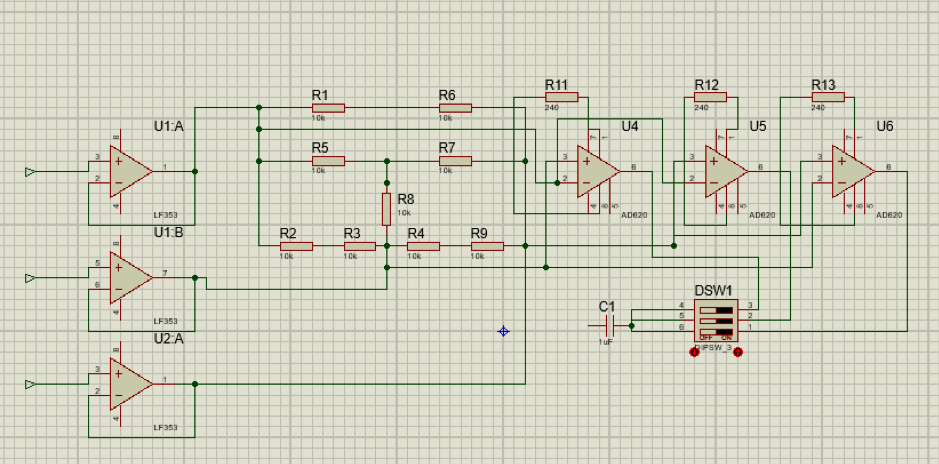
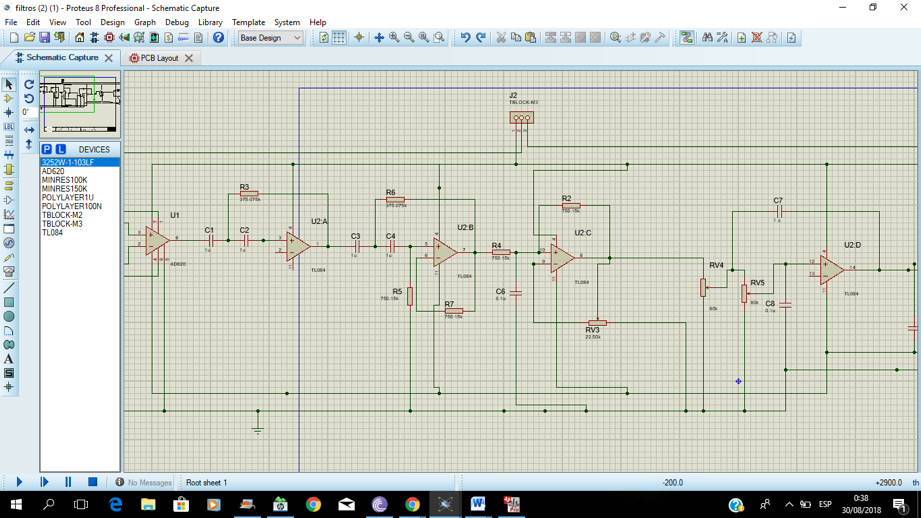
image 4. calculations resistors.image 5. calculations gains image 6. electric plane of Amplification stage and ned wilson
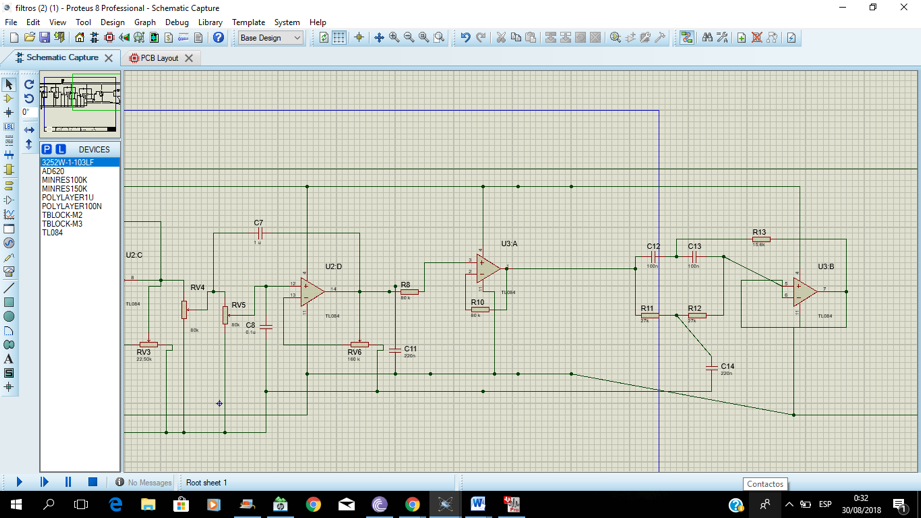
image 7 electric plane of Amplification and followersimage 8. electric plane of notch filterimage 9. electric plane of pass band filter
5. GLOSARY ·cardiac pathologies ·instrumental amplifier ·ECG ·signaling ·wilson Ned
6. ANALYSIS OF RESULTS.
For the design of the bandpass filters (1-2Hz and 100-1KHz) and the Notch Filter (60Hz) respectively, the relevant calculations were carried out in order to have a greater accuracy when making the different assemblies and thus the signal input and output were expected, the filter with frequency of 1-2 Hz had complications since it handled a very low cutoff frequency, therefore what was done was to perform the filter separately, that is, it was first made the filter passes high of 100 Hz and then the Filter passes low of 1Khz, the rest for the design of the filter that went of 100 Hz-1Khz and Notch filter did not have major difficulty since when observing the signals with their distintitas attenuations were Expected a clear example that the operation was the indicated was that in the Notch filter at the time that the frequency reached 60 Hz the output signal was greatly attenuated, already with respect to the signals of the pass It works in a similar way since the frequencies that were below 1Hz were letting them pass while the frequencies that were above 2 Hz attenuated them in a perfect way in the same way it happened with the filter that went from 100-1Khz. The last one was able to observe the ECG simulator signal with its different frequencies (60, 90 and 120 ppm) in the oscilloscope satisfactorily managing the different gains of the signal with the use of the potentiometer and thus it was assumed that both the simulator and the Filters were perfect without any distortion.
Limitations
the ground: The problem and the problem are conexion a tierra, in the corollary of the corriguio, the haciendo que el paciente sujetara con una extremidad una superficie metalica.
the capacitors: For those who want to do business, they will be able to work out their own capacities and make them more productive, and you will not be able to find them in any way, nor do they have a comedy movie, and you will be able to enjoy it.
To perform this technique, the development of the handling of biomedical signals has been progressing over the years, both for diagnosis and for medical research, where these signals are produced in the human body. This is how in this practice it allowed us to analyze the behavior of a biomedical signal (ECG), by means of a simulator made with amplifiers, capacitors, capacitors, etc. However, the analysis of different filters (Butterworth), such as low pass filter, band pass and notch were made, which allowed us to clean the simulated signal and thus have better results and in turn to understand more deeply its functionality and its analysis.
physical principle The EKG simulator has as a physical principle to generate a signal that resembles that observed by an electrocardiogram, this device has the function of providing a frame of reference with which an electrocardiogram can be calibrated.
Operational Amplifier: An operational amplifier (op-amp), is a general purpose linear device which has signal handling capability from f = 0 Hz up to a frequency defined by the manufacturer; It also has signal limits ranging from the order of nV, to a few dozen volts. Operational amplifiers are characterized by their differential input and a very high gain, generally greater than 100dB. The A.O is a directly coupled high gain amplifier, which is generally fed with positive and negative sources, which allows it to have excursions both above and below ground. The ideal Operational Amplifier is characterized by: • Input resistance, (Ren), tends to infinity. • Output resistance, (Ro), tends to zero. • Open loop voltage gain, (A), tends to infinity • Bandwidth (BW) tends to infinity. • vo = 0 when v + = v- (5)
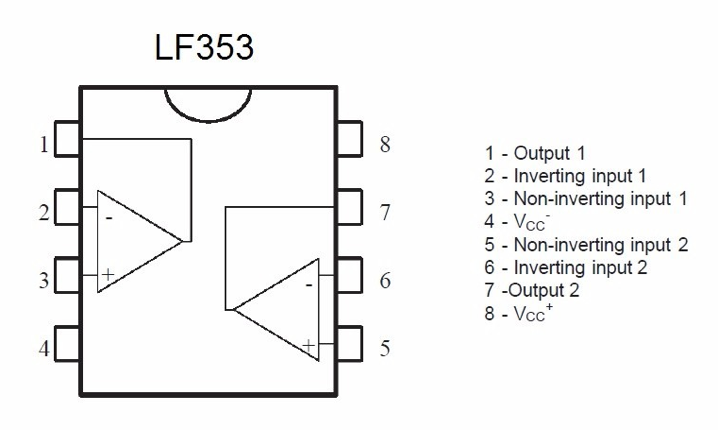
image 1. datasheet lf353
Signal processing: Signal processing can be defined broadly as the application of analog or digital techniques to improve the usefulness of a data chain. In bioengineering this improves the data, which implies a better diagnosis, likewise it helps the design of different elements (hearing aids, special prostheses, etc.) [2].
image 2. biomedical signal [2]
filters: They are a system that allows the passage of electrical signals even a certain frequency range and prevents the passage of this.
They are used mostly for conditioning input signals, digitalization of signals, signal conditioning produced. In terms of its transfer function, we find low pass, high pass, band [3] filters.
These can be constructed from operational amplifiers (lf353).
Cardiac pathologies: Heart diseases describe a range of diseases that affect the heart. Diseases classified as heart diseases include diseases of the blood vessels, such as coronary artery disease, problems with heart rhythm (arrhythmias) and heart defects with which you were born (congenital heart defects), among others.
The term «heart disease» is often used interchangeably with the term «cardiovascular disease.» «Cardiovascular disease» often refers to diseases that involve a narrowing or blockage of the blood vessels that can cause a heart attack, chest pain (angina) or stroke. Other heart diseases, such as those that affect the muscles, valves or heart rhythm, are also considered forms of heart disease.
Many forms of heart disease can be prevented or treated with choices of a healthy lifestyle.[6]
3. DEVELOPMENT
image 3. calculations capacitos, resistors and low pass filter.
image 4. calculations resistors.
Limitations
we had several disadvantages to obtain excellent results, since from the part of production of the signal from the digital simulator developed in labview, it could not be shown in the ocsiloscope, because it had a fault when transmitting the signal, from the viewpoint Analoga could observe the signal and vary its frequency and show one by one the steps from the ujt, but it had a big problem and it was that it did not show us the p wave, nor the t wave, due to that our results were not optimally what was expected.
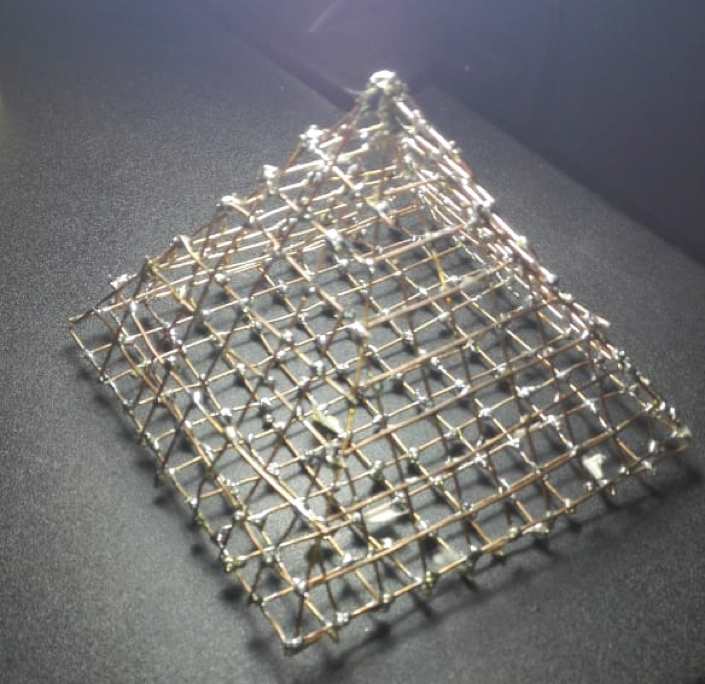
with respect to the pyramid, the wire we used was an enameled copper which caused the tin not to be soldered properly, you can see in the image 9
4. RESULTS
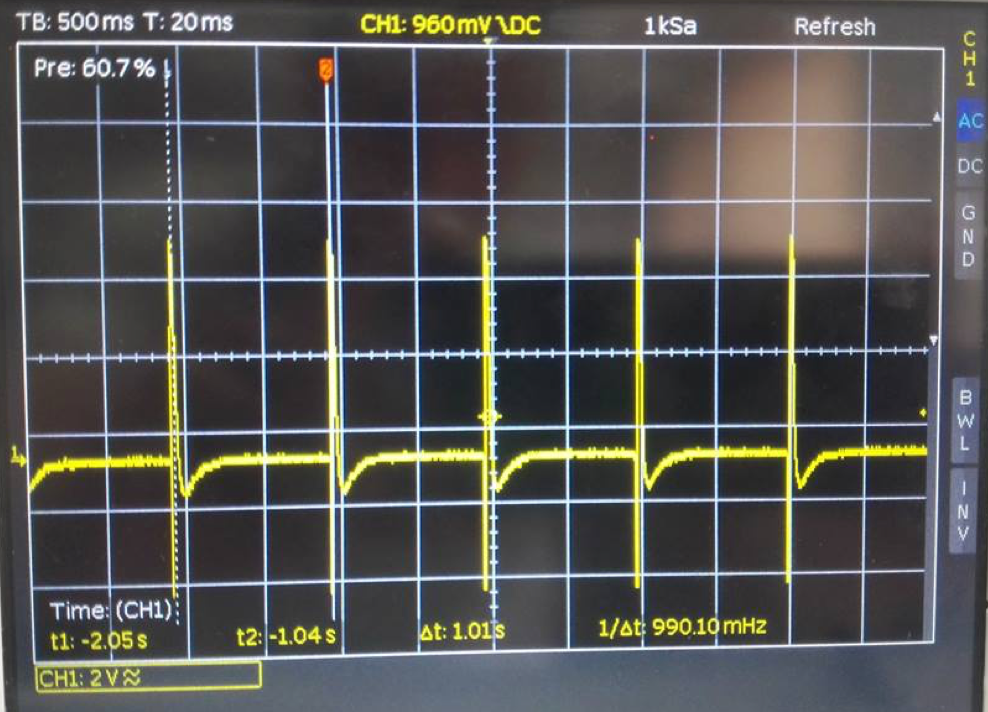
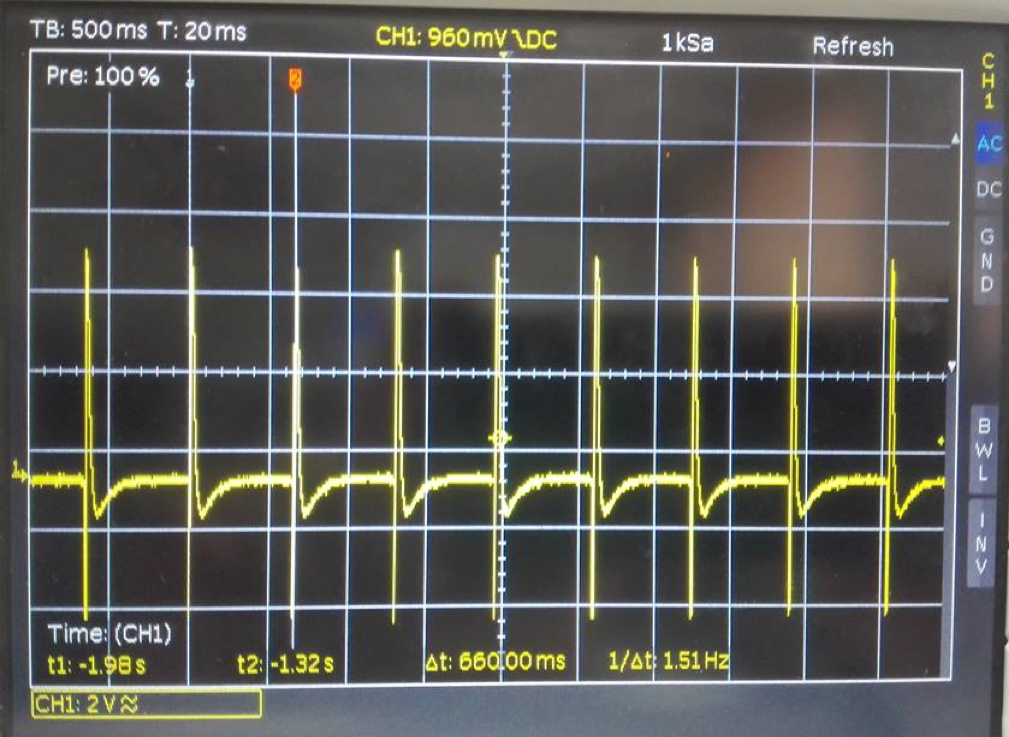
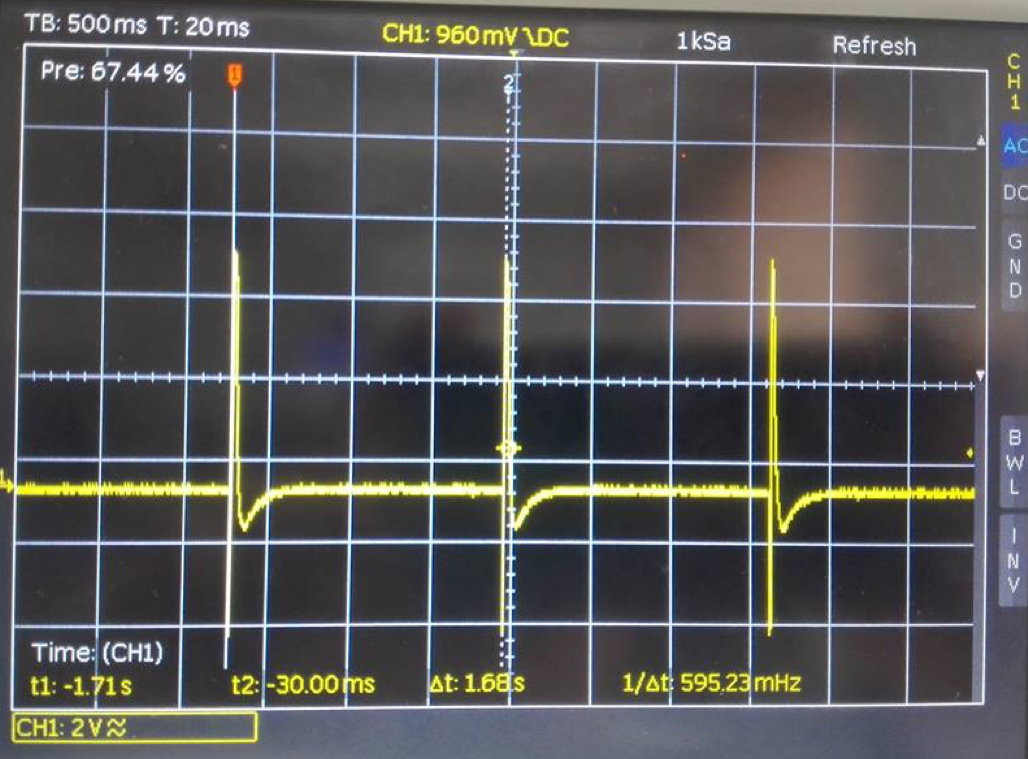
image 5. signal in the osciloscope with signal ecg normal to 60 Hz image 6. signal in the osciloscope with tachycardia to 90 Hzimage 7. signal in the osciloscope with bradycardia to 30 Hzimage 8. the pyramidimage 9. tha Welding points
in the analysis of the results we can conclude that the desired signal was not obtained, since the digital simulator developed in labview, although it had an excellent interface development, and showed all the signals proposed by the practice, it was not possible to finish the work with this tool, because it could not be shown in the ocsiloscope, because it had a failure to transmit the signal, from the analogue view part it was possible to observe the signal and vary its frequency and show the steps one by one from the ujt, but had a big problem and was not showing us the p wave, nor the t wave, due to that our results were not optimally what was expected
in the pyramid the Welding points, they were not as expected, because the tin did not stick the wires as it was wanted, the wire used was copper, with a problem, it was enameled, which made the solder not pick up as it was panes, then there were many points that were released
7. BIBLIOGRAPHY [1]Lisa Catón V, Carpintero Escudero JM, Marco Aguiar P, Ochoa Gómez FJ. Utilidad del Pulsioximetro en un Centro de Salud. FMC 1999; 6, (8): 517- [Texto completo] [2] Herrera Carranza M. Fisiología respiratoria. Conceptos Básicos. Iniciación a la Ventilación Mecánica. Barcelona: Edika-Med;1997. [3] Sinex JE. Pulse oximetry: principles and limitations. Am J Emerg Med 1999 Jan; 17 (1): 59-67.[Medline] [4]González-Ortega, D., Díaz-Pernas, F. J., Martínez-Zarzuela, M., & Antón-Rodríguez, M. (2019). A physiological sensor-based android application synchronized with a driving simulator for driver monitoring. Sensors, 19(2), 399. [5] Amplificadores de Transimpedancia (2017). Los amplificadores de transimpedancia para fotodiodos de amplio rango presen- tan exigentes requisitos. Recuperado (8 de Marzo de 2018)de:“https://www.redeweb.com/ficheros/articulos/arrow.pdf “ [6]Bonet, L. A. (2000). Registro Español de Trasplante Cardíaco. XI Informe Oficial (1984-1999). Revista Española de Cardiología, 53(12), 1639-1645.
VERY THANKS for watched this blog.Compartida públicamente
The centrifugation is a mechanical method of separation of immiscible liquids, or solids and liquids by the application of a centrifugal force. This force can be very large. The separations that are carried out slowly by gravity can be accelerated to a great extent with the use of centrifugal equipment.
Centrifugal or centrifugal pumps are used in different types of industries: chemical industry, petrochemical, refineries, food, pharmaceutical, textile, sugar, etc.
Spirometry is a basic test for the study of pulmonary function, and its performance is necessary for the evaluation and monitoring of respiratory diseases. Its usefulness transcends the field of pulmonology, and in recent years it is progressively being incorporated into primary care and other medical disciplines.
The spirometer is a technique for the diagnosis of respiratory diseases, because it offers a variety of data that allow a complete diagnosis. Thanks to the advancement of technology, it is easy to perform the examination, by calculating flow and volume, important variables in the spirometer technique. it is possible to determine if there is obstruction in the respiratory tract or if, on the contrary, they are in a healthy state.
List of Equipment and Materials:
Engine
arduino
arduino conector
optocuupler 4n26
protoboard
lcd
transistor 2n2222
switch
2. CONTEXTTS
During the practice a tensiometer was developed by means of a silicon pressure sensor designed for a wide range of which is the MPX5100dp, by means of the designed code the visualization of the diastolic and average systolic pressure in an LCD is allowed.
ENGINE
The DC motor (DC motor) is a machine that converts electrical energy into mechanical, causing a rotary movement. In some modifications, they exert traction on a rail. These engines are known as linear motors.
A direct current machine (generator or motor) consists mainly of two parts, a stator that gives mechanical support to the device and has a hole in the center, generally cylindrical in shape. In the stator there are also poles, which can be permanent magnets or windings with copper wire on an iron core. The rotor is generally cylindrical in shape, also wound and with a core, to which the current comes through two brushes. (National Experimental University of Táchira Department of Electronic Engineering Nucleus of Electricity Curricular Unit Electrical Technology) [3]
ENCODER
Encoders convert the movement into an electrical signal that can be read by some type of control device in a motion control system, such as a counter or PLC. The encoder sends a response signal that can be used to determine the position, count, speed or direction. A control device can use this information to send a command for a particular function. [1] (ENCODER PRODUCTS COMPANY).
OPTOACOPLATOR
An optocoupler, also called optoisolator or optically coupled isolator, is an emitting and receiving device that functions as a switch activated by light emitted by an LED diode that saturates an optoelectronic component, usually in the form of a phototransistor or phototriac.
ARDUINO
Arduino is a free hardware platform, based on a board with a microcontroller and a development environment, designed to facilitate the use of electronics in multidisciplinary projects. On the other hand Arduino provides us with software consisting of a development environment (IDE) that implements the programming language of arduino and the bootloader executed on the board. The main feature of programming software and the programming language is its simplicity and ease of use. [2]
3. DEVELOPMENT
4. RESULTS
5. ANALISYS OF THE RESULTS
For the design of the centrifuge there were different stages. The first stage in the class session was the prototype of the centrifuge where the alarm system was installed to determine when the lid is lifted then the characterization of the encoder was proceeded, in order to observe the operation of the encoder with light and observing the variation of voltage in the output that in some cases was too short, the second stage was the programming of the keyboard so that when a number was entered it would print in order to show the revolutions per minute and time on the LCD.
I tested that the keyboard worked properly observing it on the LCD the time and the revolutions per minute correspondingly and taking out the respective calculation of the revolutions per minute in order to look at the speed at which the encoder rotates , in the third stage the part of the arduino code was added with the visualization in the LCD with the objective main to observe already the RPM in the LCD and the time (seconds) and the fixed dual power, but for this code there were too many inconveniences since the ranges that were managed to have a greater accuracy in the RPM was too difficult to calibrate that the code took too many values to get an accurate RPM but not exact, what was done as the next and last stage was to analyze the code carefully and place certain conditions so that it would not take so many values at a certain time and so with the help of the clamp an accuracy like that achieved by observing an adequate RPM value.
Finally, a positive result was obtained when observing the RPM per minute in the structure, since the code used in the Arduino was the expected one since the visualization was given correctly in the LCD without any anomaly; observing additionally on the screen both the time and the revolutions per minute according to the values chosed
[3]Universidad Nacional Experimental del Táchira Departamento de Ingeniería Electrónica Núcleo de Electricidad Unidad Curricular Tecnología Eléctrica. (s.f.). Conceptos Básicos de Máquinas de corriente continua. págs. file:///C:/Users/olgabeatriz/Downloads/MotoresDC-conceptosbasicos-MAPC.pdf.